
Finacial Highlights
Sales
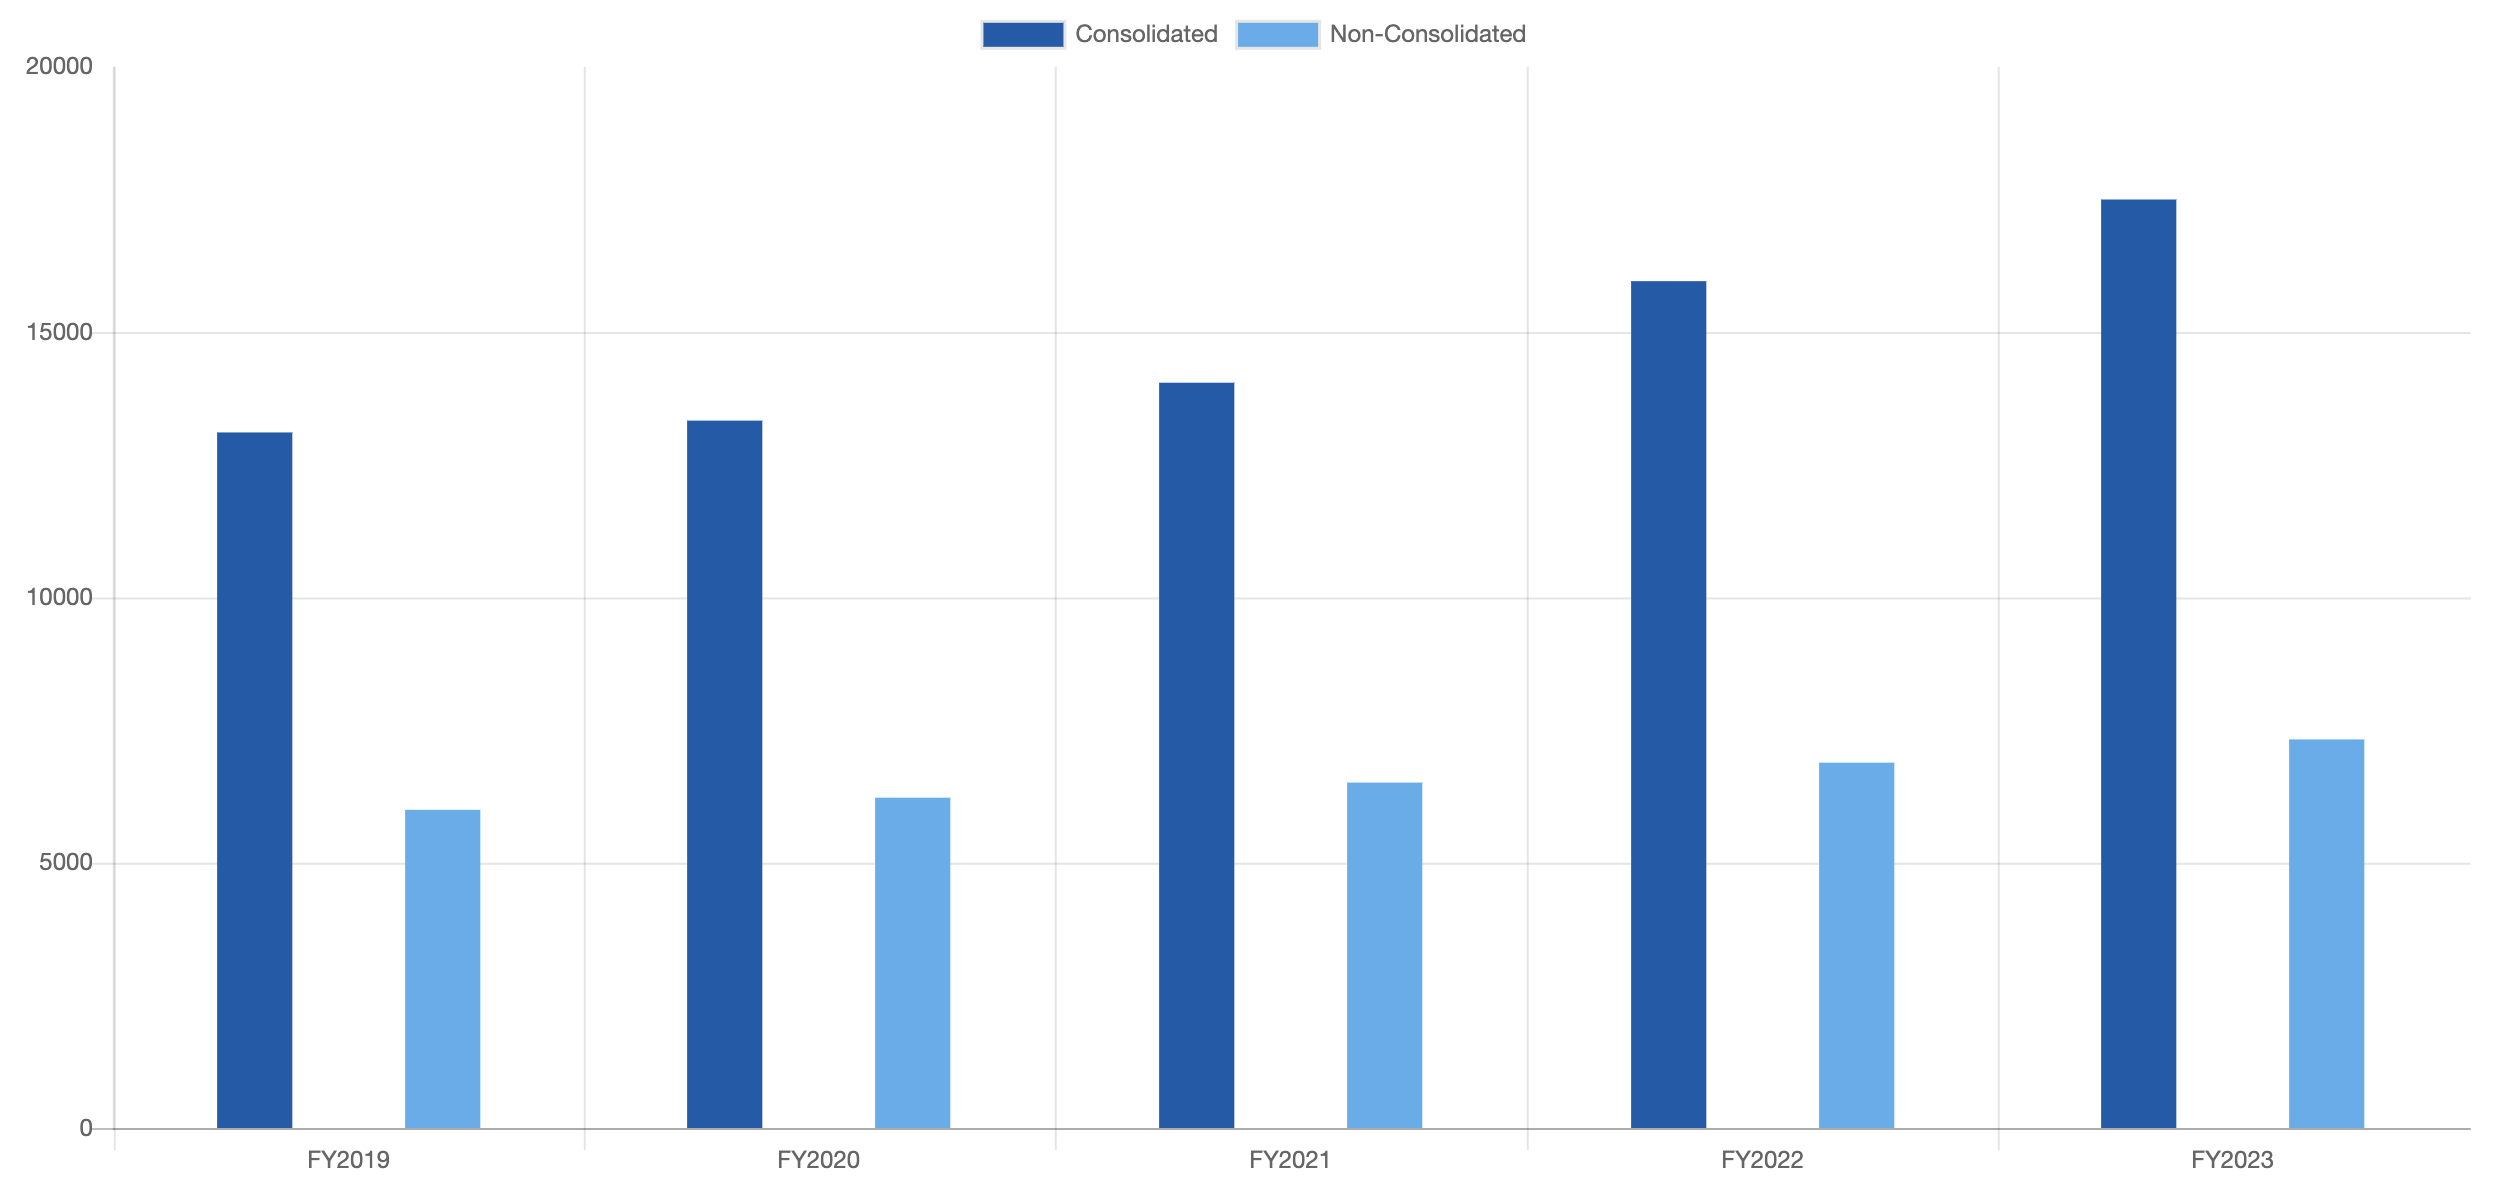
| FY2019 | FY2020 | FY2021 | FY2022 | FY2023 | FY2024 (FCST) |
|
|---|---|---|---|---|---|---|
| Consolidated | 13,109 | 13,332 | 14,046 | 15,960 | 17,499 | 19,250 |
| Non-Consolidated | 5,996 | 6,225 | 6,510 | 6,885 | 7,323 | - |
Operating Profit
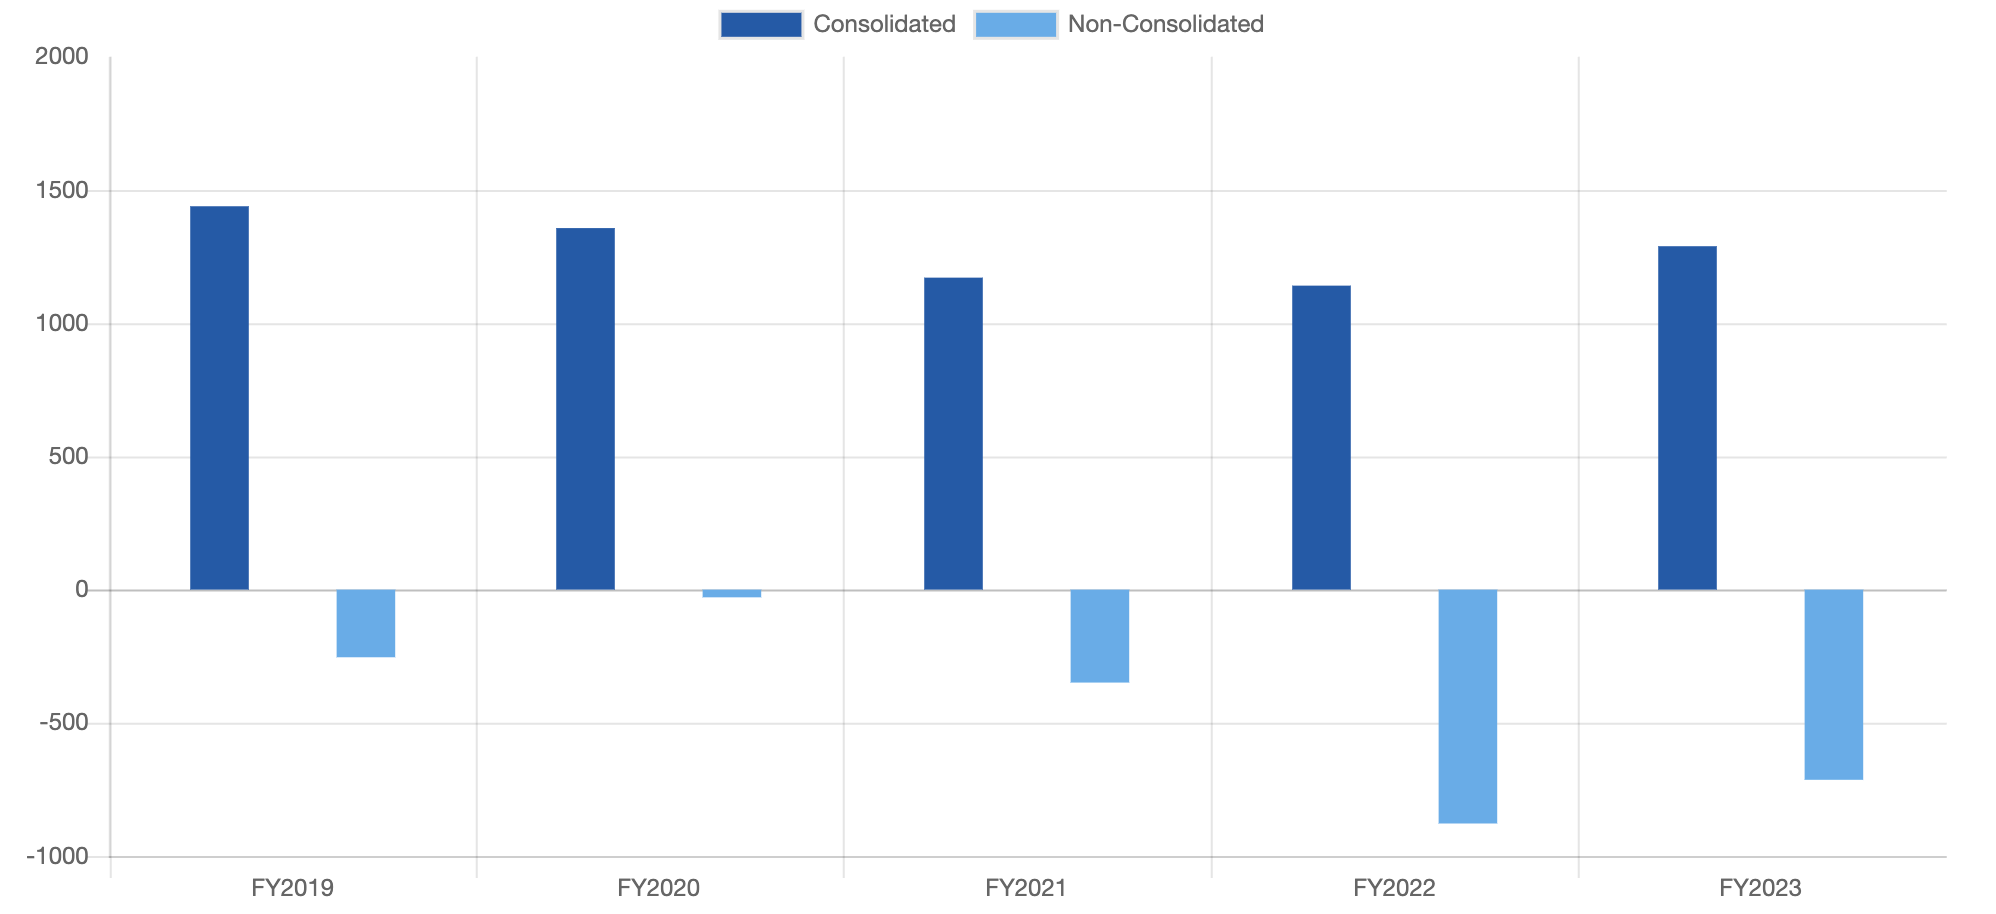
| FY2019 | FY2020 | FY2021 | FY2022 | FY2023 | FY2024 (FCST) |
|
|---|---|---|---|---|---|---|
| Consolidated | 1,439 | 1,357 | 1,171 | 1,141 | 1,289 | 1,450 |
| Non-Consolidated | △254 | △29 | △349 | △878 | △714 | - |
Ordinary profit
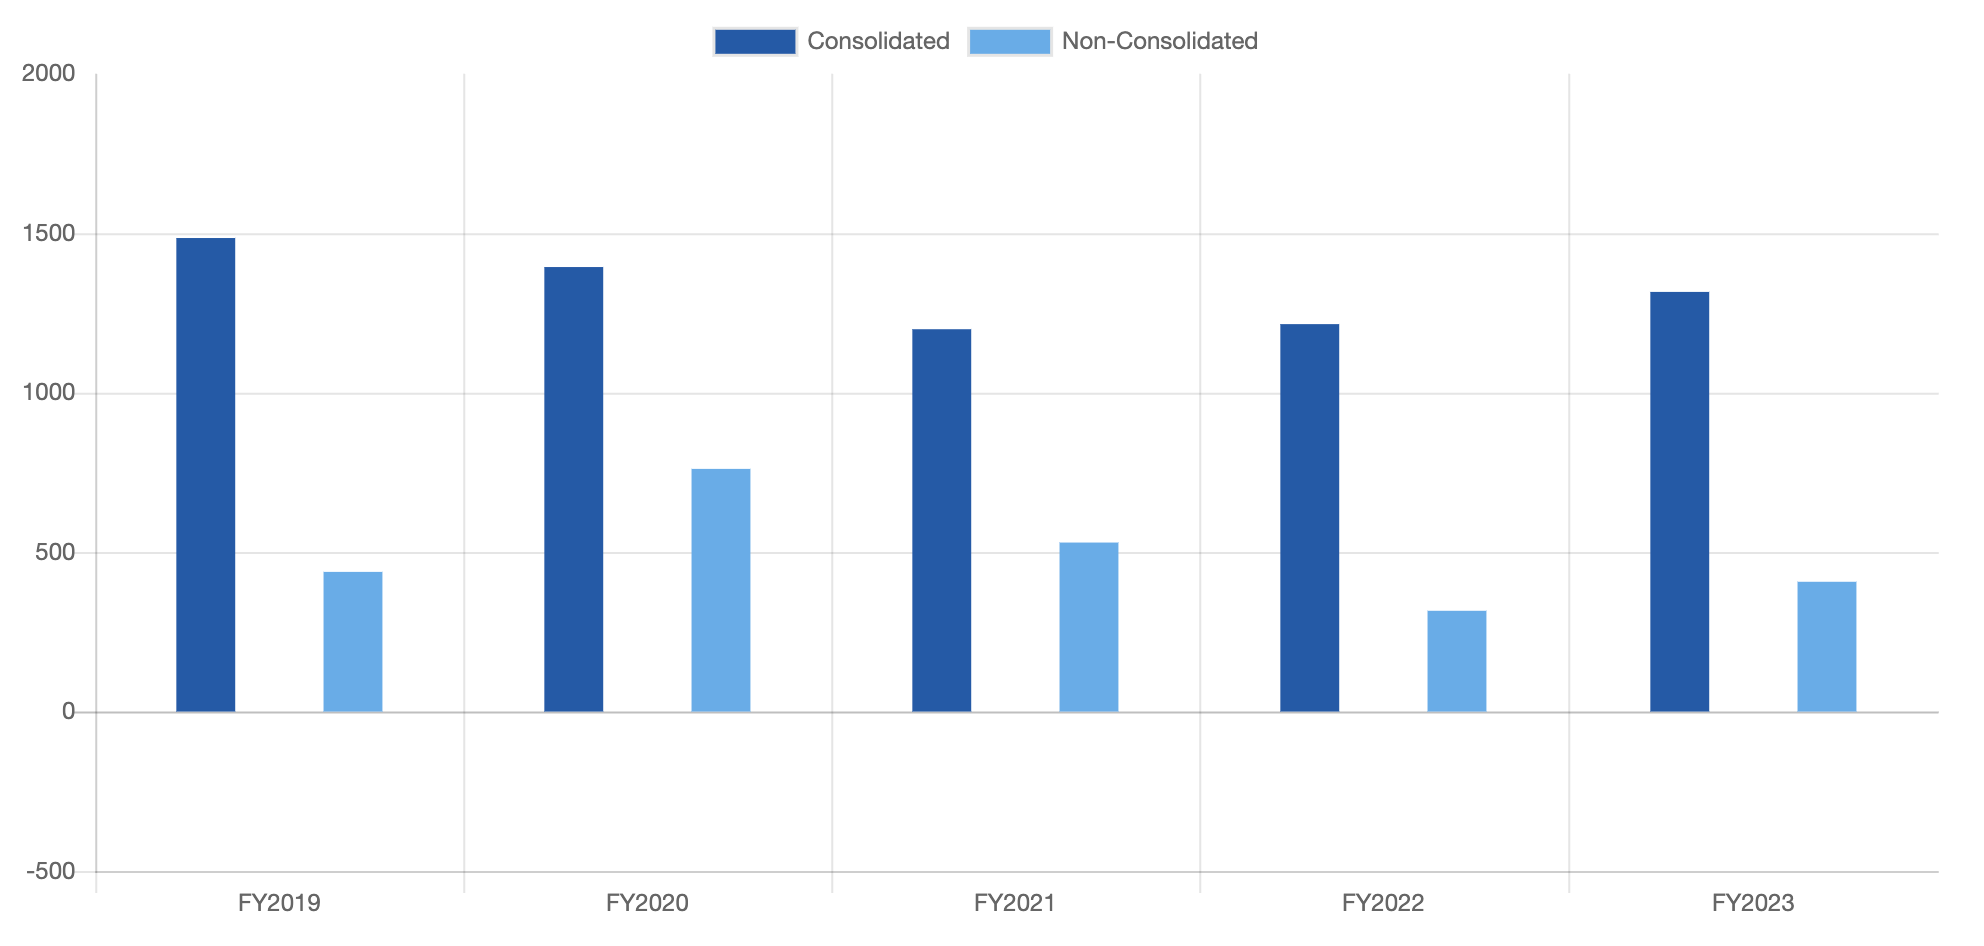
| FY2019 | FY2020 | FY2021 | FY2022 | FY2023 | FY2024 (FCST) |
|
|---|---|---|---|---|---|---|
| Consolidated | 1,485 | 1,394 | 1,199 | 1,215 | 1,316 | 1,387 |
| Non-Consolidated | 438 | 761 | 530 | 316 | 407 | - |
Net Profit
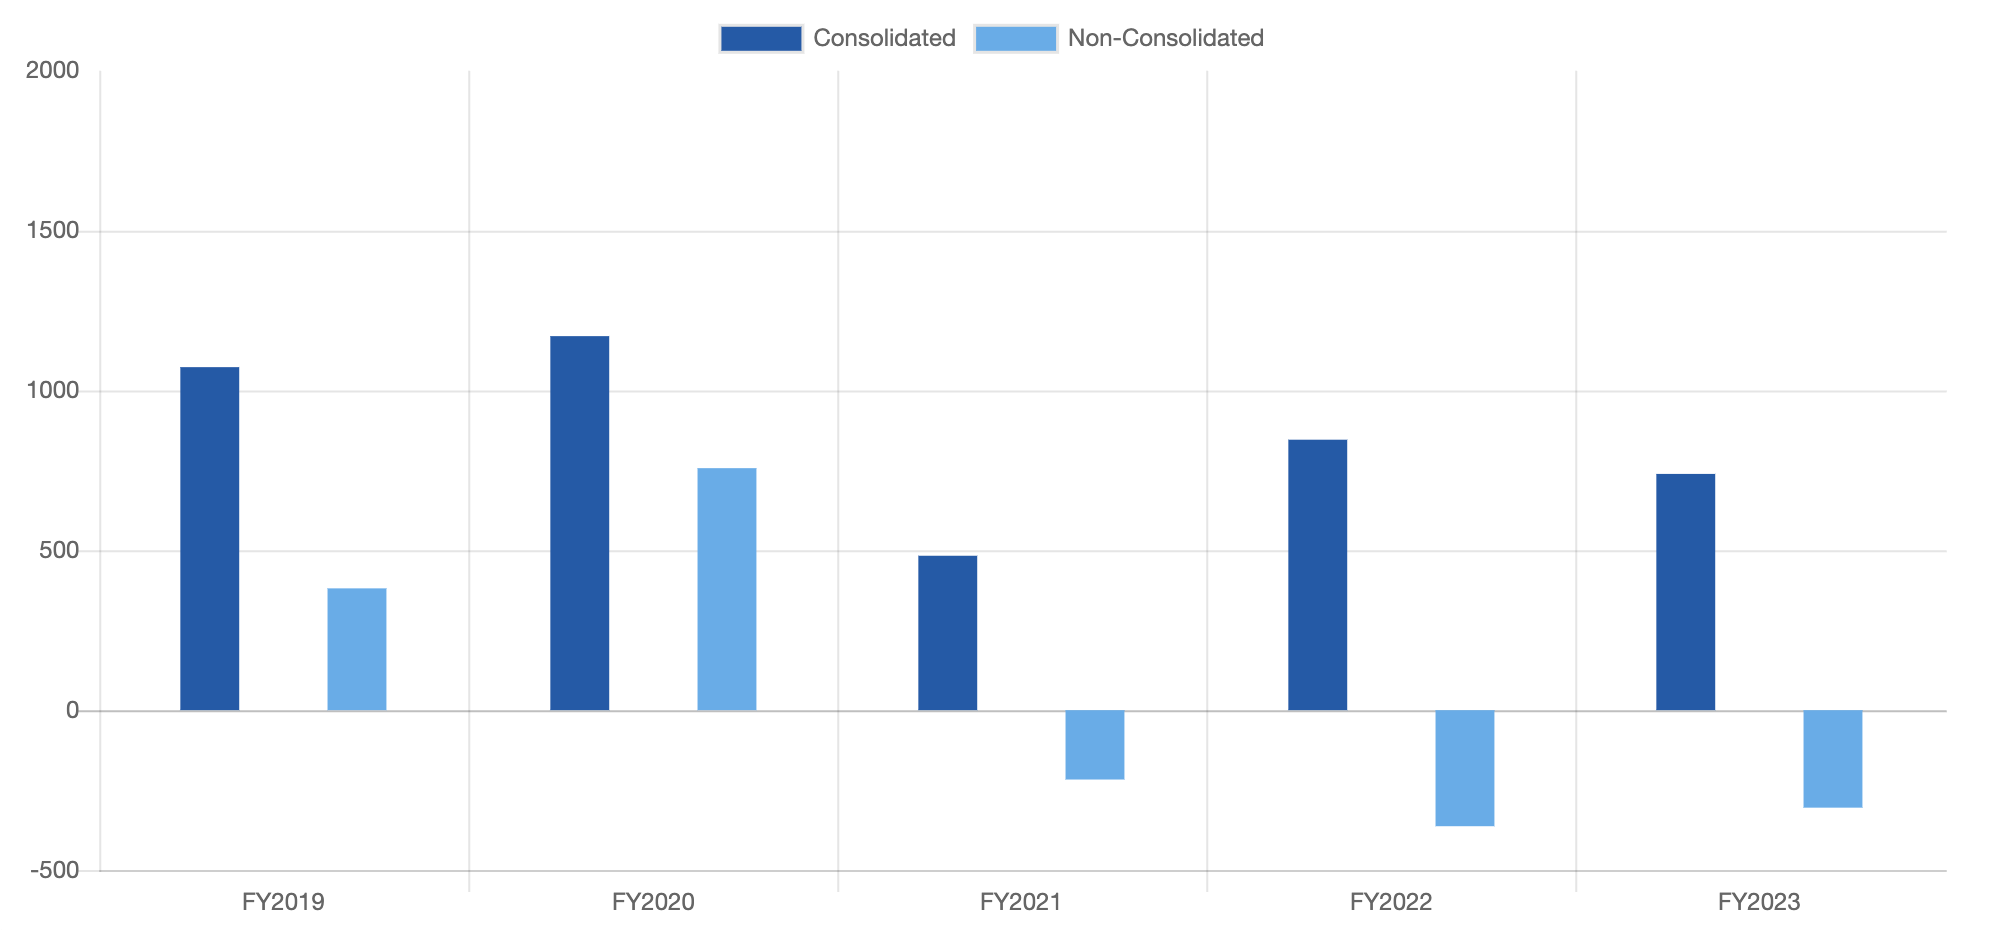
| FY2019 | FY2020 | FY2021 | FY2022 | FY2023 | FY2024 (FCST) |
|
|---|---|---|---|---|---|---|
| Consolidated | 1,073 | 1,070 | 483 | 846 | 739 | 840 |
| Non-Consolidated | 381 | 757 | △217 | 363 | 305 | - |